Dealers have to hedge
The firms on the other side of options trades buy and sell the underlying to stay balanced.
 GEXFlow
Get access
Options data intelligence
GEXFlow reads the options market three times a day and draws the key price levels straight onto your TradingView chart. No spreadsheets. No options chain. Just a clean map.
NFA · A levels map for analysis and education. Not financial advice. Not a signals service.
Example for illustration. Not live data.
The idea in 20 seconds
The firms on the other side of options trades buy and sell the underlying to stay balanced.
Where a lot of options sit at one strike, that hedging clusters. Price often stalls, turns or speeds up there.
We turn that data into clear lines on your chart, so you can plan around them.
“GEX” means gamma exposure: a measure of how much hedging a price move would force at each strike.
Try it
Tap through the four steps and watch the engine work.
Illustrative numbers, not live data.
What you see on the chart
The strongest level above price. Often acts like a ceiling.
The strongest level below price. Often acts like a floor.
The line where market behaviour tends to change: calmer above, jumpier below.
The price where option buyers would lose the most at expiry.
Other strong spots in the data, ranked by strength.
Levels are areas to watch, not predictions. Price can and does go through them.
The engine
Every refresh runs the same five steps, start to finish, with no manual chart drawing.
Pull fresh options data for 20 tickers.
Add up the gamma at every strike.
Keep the strong levels. Never invent any.
Translate to futures prices using live prices.
Update the indicator and post to Discord.
Fresh three times a day
Built from the previous day's closing positions. Ready before you wake up.
The first data after the stock market opens. Includes the 13 stocks.
Positions after the close, for the evening futures session.
Times are Eastern (New York / Toronto), on trading days. Every map shows its date and session so you always know how fresh it is.
24 markets, one indicator
Tap a symbol to see where its levels come from.
Make it yours
Try the settings below. The real indicator has these and more.
Preview only. Colours in the real indicator may differ slightly.
On real charts
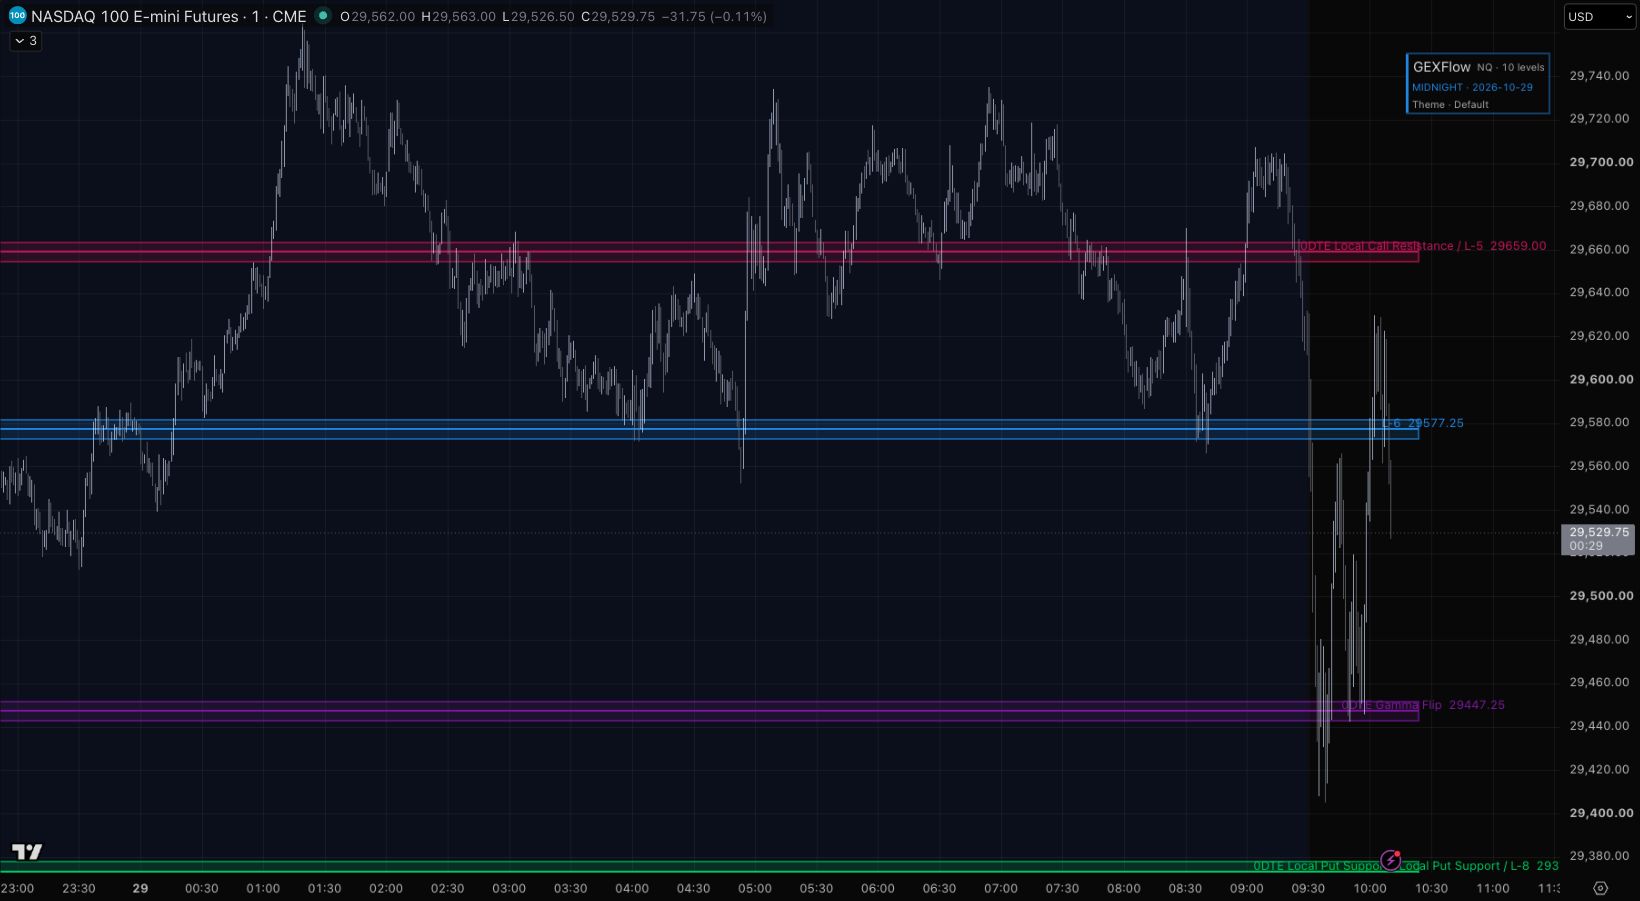
Real screenshots, shown so you can see the indicator. They are not a promise of how price will behave.
Free education
Three short videos, free for everyone. No sign-up and no membership needed.
These videos are for education only. They are not financial advice and not trade signals.
One membership
Options levels for 24 markets: walls, gamma flip, max pain and ranked gamma levels, for each session.
Session ranges, pivots, highs and lows, prior-day levels and key opens.
Higher-timeframe candles on your chart, so you keep the bigger picture in view.
A bot posts every new map. Plus recorded lessons and recaps that explain how to read it.
Pricing
Every plan includes everything. Checkout is handled securely by Whop.
$20/ week
Try it for a week.
$65/ month
Free for 1 day, then $65 a month.
$650/ year
About $54 a month. Two months free compared with monthly.
Not financial advice (NFA). GEXFlow is a charting and education tool. It does not tell you to buy or sell, and it does not guarantee results. Trading involves risk of loss.
Questions
No. GEXFlow never says buy or sell. It draws a map of important price levels. What you do with it is up to you.
No. The engine reads the options data for you. You just see lines on your chart, each with a plain label.
A TradingView account. After you join on Whop, you enter your TradingView username and the indicators are added to your account.
NQ, ES, gold, silver, YM and RTY futures (plus their micros), QQQ, SPX, SPY, GLD, SLV and 13 popular stocks including NVDA, TSLA and AAPL.
Three times each trading day: Midnight, New York (9:31 AM) and Globex (6:01 PM), Eastern time. Stocks update in the New York session only.
Options gamma data from Unusual Whales, plus live prices to convert levels to futures charts.
It is only a chart overlay in TradingView. It does not place trades or connect to any broker.
Yes, anytime, from your Whop account.